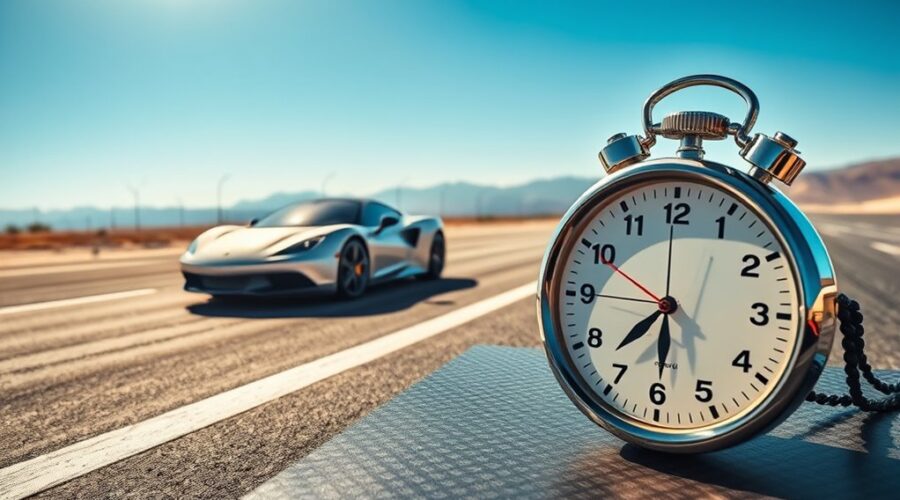
0-60 times measure how quickly a vehicle can accelerate from a standstill to 60 mph, but the number hides more than it reveals. It reflects power, mass, traction, gearing, and launch control behavior, not horsepower alone. The metric gained status because it offers a simple performance benchmark, yet testing methods and drivetrain differences can alter results considerably. The real question is which factors matter most when the stopwatch starts.
What a 0-60 Time Measures
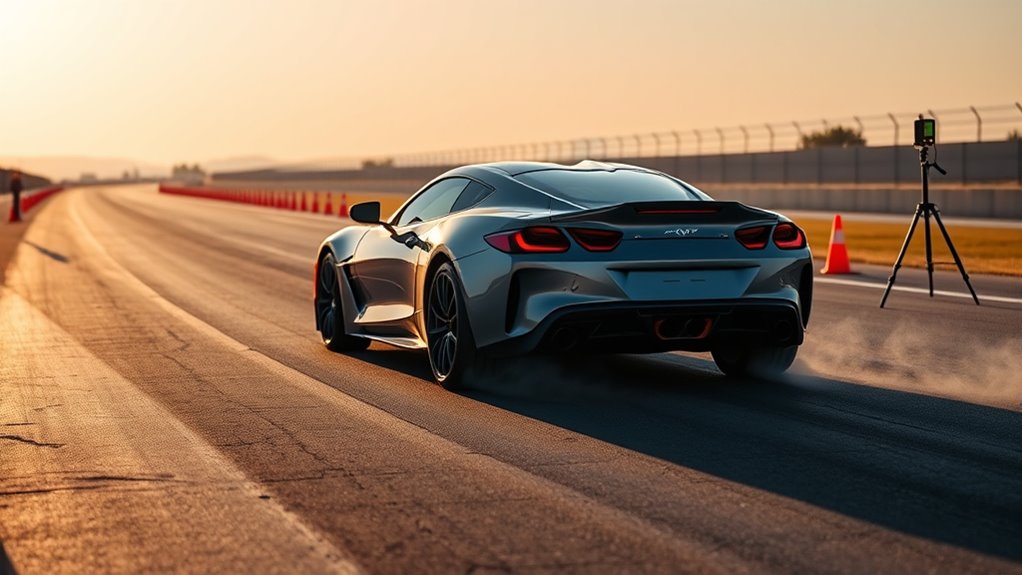
A 0-60 time measures how quickly a vehicle accelerates from a complete stop to 60 miles per hour, making it a standard benchmark in automotive performance testing.
In the United States, it functions as a compact indicator of engine output, mass efficiency, tire adhesion, and transmission behavior. The measure is derived on a flat, dry surface to reduce external variation and isolate the vehicle’s acceleration capability.
Lower numbers indicate stronger launch performance; higher numbers indicate slower response. A high-performance sports car may register under 4 seconds, while an average sedan may require 7 to 10 seconds.
Lower numbers signal stronger launch performance, with sports cars under 4 seconds and sedans often taking 7 to 10.
The metric does not describe top speed or handling; it quantifies only the sprint to 60 mph. For consumers seeking autonomy in vehicle choice, it offers a direct comparison across models, translating mechanical differences into a clear, repeatable figure.
Why 0-60 Became a Key Metric
0-60 mph became a key metric because acceleration evolved into a visible status indicator, especially as consumers equated quick launches with higher performance.
Its prominence also reflects racing and muscle-car roots, where rapid straight-line speed was a practical and cultural benchmark.
Automakers later amplified the figure in advertising and reviews, making it a standardized shorthand for responsiveness.
Acceleration As Status Symbol
Acceleration to 60 mph became a key benchmark because it offers a compact measure of a vehicle’s power, throttle response, and real-world performance.
By the mid-20th century, it functioned as a clear proxy for capability, then in the 1960s it gained force as muscle cars and performance cars turned acceleration into a public metric.
Luxury appeal also shaped its rise: brands used 0-60 figures to signal engineering depth, exclusivity, and social status. That framing altered performance perception, making numbers part of identity rather than mere specification.
Today, sub-4-second claims remain common among elite models, supported by advances in engines, aerodynamics, and materials.
As a marketing tool, 0-60 times provide consumers with a direct, comparative language for speed, prestige, and mechanical freedom.
Racing Roots Matter
Racing heritage helped convert 0-60 mph from a niche figure into a mainstream benchmark, especially during the muscle car era of the 1960s when acceleration became a visible marker of consumer demand. The metric offered a direct, repeatable way to compare vehicles, turning abstract power into measurable performance benchmarks.
Under muscle car influence, quick launches became evidence of mechanical strength and road freedom. Sports cars and later high-performance models reinforced the standard, since fast acceleration signaled control, capability, and status without requiring complex instrumentation.
As engineering advanced through turbocharging and electric drivetrains, 0-60 times sharpened further, raising expectations and tightening comparisons across classes. The result was a simple, liberated language of speed grounded in racing heritage and accessible to buyers seeking objective pace.
Marketing Made It Mainstream
By the 1970s, a clear performance metric had become a useful marketing instrument, and 0-60 mph emerged as a concise way to advertise acceleration without requiring technical expertise.
Manufacturers and magazines integrated the figure into advertising strategies and reviews, converting raw speed into a standardized comparison point. This alignment exploited consumer psychology: a lower time signaled control, power, and escape from mediocrity.
In the 1980s, sports cars and muscle cars amplified the metric’s visibility by presenting acceleration as an immediate, almost cinematic proof of dominance.
Over time, 0-60 shaped performance perception across the market, making acceleration legible to non-specialists.
Today it remains a default specification, with brands competing for faster numbers to attract buyers seeking liberated, high-response driving.
How Cars Are Tested 0-60
The 0-60 mph test measures how long a vehicle takes to accelerate from a complete stop to 60 mph, making it a standard indicator of speed and power.
Manufacturers use strict test protocols to limit variation: a flat, dry surface, consistent launch conditions, and repeatable runs. Advanced timing technology, often GPS based, replaces manual methods and reduces human error. Engineers then compare elapsed times to identify how tire grip, vehicle weight, and engine output shape performance.
Environmental factors such as pavement moisture, temperature, and surface quality can alter results, so controlled conditions matter. Some manufacturers also publish alternate figures for wet pavement or other scenarios, not to obscure the metric, but to show how the machine responds when freedom from constraint is challenged.
The result is a measurable benchmark, useful for analysis, competition, and transparent assessment of acceleration capability.
Gas Cars vs. EVs at 0-60
Gas cars typically reach 0-60 mph in about 5 to 8 seconds, while EVs often do it in 2.5 to 4 seconds because electric motors deliver peak torque immediately.
This performance comparison reflects distinct torque dynamics: internal combustion engines must build revs and often depend on gear changes, whereas electric drivetrains convert stored energy into force with minimal delay.
In vehicle technology terms, EVs exploit dense battery power and simplified drivetrain control to produce rapid launches that feel unrestrained and direct.
Gas cars remain capable, but their acceleration curve is usually less immediate and more variable across engine sizes and configurations.
The Rimac Nevera and Tesla Model S Plaid demonstrate the upper boundary of electric capability, with sub-2-second sprints that redefine production-car norms.
Still, both powertrains are constrained by mass, battery capacity, and drivetrain design, which shape real-world 0-60 results and determine how freely acceleration can be delivered.
What Impacts 0-60 Times Most
Acceleration is shaped most directly by engine power, vehicle weight, tire grip, transmission type, and aerodynamics. These factors determine how efficiently force becomes forward motion, and how much friction or drag resists that conversion. Engine tuning can raise torque delivery and sharpen response; however, gains depend on traction and mass. Weight distribution also matters, because balanced loads help tires use available grip without wasted slip. Tire technology is often decisive at launch, since compound, construction, and temperature affect traction.
| Factor | Effect | Relative impact |
|---|---|---|
| Power | More force | High |
| Weight | Less mass | High |
| Tires | Better grip | High |
Transmission behavior further shapes the run by reducing shift delay, while aerodynamic drag becomes more relevant as speed rises. In practice, the quickest 0-60 results come from a coherent package, not a single metric. Liberation from slow acceleration depends on disciplined engineering across all these variables.
Fastest 0-60 Cars in History
The fastest 0-60 cars in history are defined by record-breaking acceleration, with the Bugatti Chiron Super Sport 300+ posting 2.4 seconds and the Rimac Nevera reaching 1.85 seconds.
These results reflect launch-focused engineering, including high-output powertrains, traction control, and optimized torque delivery.
Historic contenders such as the Tesla Model S Plaid, Porsche 918 Spyder, and McLaren P1 illustrate how electric and hybrid systems have reshaped top-tier acceleration.
Record-Breaking Acceleration
Among the fastest production cars ever tested, 0-60 mph times have become a defining benchmark for launch performance, with current leaders compressing the sprint into under 2.5 seconds.
- Rimac Nevera: 1.85 seconds, 1,914 horsepower, advanced all-wheel drive.
- Tesla Model S Plaid: 1.99 seconds, proving electric torque can redefine acceleration technology.
- Bugatti Chiron Super Sport 300+: about 2.4 seconds, sustained by a 1,600-horsepower W16.
Performance comparisons show that hybrids and hypercars remain competitive: the Porsche 918 Spyder reaches roughly 2.5 seconds, while the McLaren Speedtail records 2.9 seconds despite a 250 mph top speed.
These figures indicate liberation from old assumptions about speed, as future innovations increasingly favor electrification, traction management, and instant response.
Engineering Behind Launch
Engineering behind launch in the fastest 0-60 mph cars depends on power delivery, traction control, and drivetrain architecture, with the Rimac C_Two leading at 1.85 seconds through a 1,914-horsepower all-electric system. Launch technology advancements reduce wheelspin by distributing torque instantly. Powertrain optimization strategies balance current, gearing, and weight transfer.
| Car | 0-60 mph | Key system |
|---|---|---|
| Rimac C_Two | 1.85 s | EV, 1914 hp |
| Tesla Model S Plaid | 1.99 s | Tri-motor AWD |
| Bugatti Chiron Super Sport 300+ | 2.4 s | Quad-turbo W16 |
| Porsche 918 Spyder | 2.5 s | Hybrid V8+EV |
| McLaren P1 | 2.8 s | Carbon-fiber hybrid |
Traction control innovations convert raw output into usable thrust, enabling faster, more liberated launches without sacrificing stability.
Top Historic Contenders
Moving from launch mechanics to benchmark results, the fastest 0-60 mph cars in history are defined by a narrow set of elite performers.
These historic performance benchmarks map the shift from combustion dominance to electric authority, while preserving legendary speed records. The top contenders include:
- Rimac Nevera: 1.85 seconds, an all-electric hypercar that redefines traction-limited acceleration.
- Tesla Model S Plaid: 1.99 seconds, a production EV that normalized sub-2-second claims.
- Bugatti Chiron Super Sport 300+: 2.4 seconds, a combustion icon anchoring iconic automotive evolution.
Near them, the Koenigsegg Jesko Absolut and McLaren P1 reinforce that hybrid and twin-turbo systems still matter.
Together, these figures show liberation through speed: each launch compresses delay, expands capability, and resets the practical ceiling of road-car performance.
How 0-60 Performance Has Evolved
0-60 mph performance has progressed from a notable benchmark of under 10 seconds in the 1964 Ford Mustang to sub-7-second figures by the 1980s, driven by turbocharging and fuel injection in cars such as the Porsche 944.
This shift reset performance benchmarks and reflected engineering advancements that translated freer airflow, tighter fuel control, and lower mass into measurable gains.
Automotive competition then accelerated development, as manufacturers pursued quicker launch times to signal technical superiority and broaden market appeal.
In the 1990s, the McLaren F1 cut the figure to 3.2 seconds, showing that power delivery and chassis control could be integrated at extreme levels.
The 2000s brought electric propulsion, with the Tesla Model S using instant torque to reach 2.5 seconds.
Today, hypercars such as the Rimac C_Two approach sub-2-second runs, proving that acceleration has become a disciplined outcome of systems engineering, not merely displacement or peak output.
Common 0-60 Myths to Ignore
Despite the steady reduction in 0-60 times over the decades, common assumptions about what determines acceleration often oversimplify the test. Horsepower myths persist because peak output alone does not govern launch performance; mass, aerodynamics, and transmission ratios shape the result. Weight distribution matters as much as curb weight, since traction transfer can decide whether power reaches the pavement or spins away.
- AWD advantages are real, but not universal; added drivetrain mass can offset grip gains, and some 2WD layouts perform better when tuned for balance.
- Newer cars are not automatically quicker; calibration, gearing, and software can let older models compete effectively.
- Tire compound and condition remain decisive, often changing results more than small engine differences.
A technical reading of 0-60 data rejects simplistic ranking. Liberation from these myths requires attention to the full system, not one spec.
What 0-60 Times Mean on the Road
On paper, the 0-60 figure measures how quickly a vehicle can accelerate from a standstill to 60 miles per hour, making it a standard benchmark for evaluating performance.
On the road, it translates into real world applications such as merging, passing, and launching from traffic lights, where acceleration shapes the driving experience. Shorter times usually indicate stronger power-to-weight ratios and more immediate throttle response.
Modern sports cars often post sub-4-second runs, while high-performance electric vehicles can drop near 2.4 seconds, showing how electric torque changes consumer perceptions of speed.
Yet recorded numbers are not absolute. Road surface, weather, tire grip, and testing method can alter results, which is why controlled conditions matter.
For drivers seeking freedom, the figure is useful because it quantifies how readily a machine can move, not just how fast it can eventually travel. It is a concise metric, but only one part of performance.
Frequently Asked Questions
What Are Some Interesting Facts About Time and History?
Time measurement evolved from sundials to cesium-based seconds, reshaping historical timelines. Ancient empires overlapped with modern universities; steam locomotives and bicycles emerged close together; the Moon landing preceded France’s last guillotine execution, revealing cultural significance.
What Are the 5 C’s of History?
Like a compass, the 5 C’s of history are change over time, context, causality, complexity, and contingency. They guide cause analysis, cultural context, and chronological framework, enabling liberation through rigorous, analytical understanding.
What Are the Five Major Time Periods of History?
The five major time periods of history are Prehistoric, Ancient, Middle Ages, Renaissance, and Modern. Ancient Civilizations shaped early states; Renaissance Innovations revived knowledge; Modern Revolutions restructured power and liberated societies through industry and reform.
What Are the 10 Most Important Events in History?
Ten pivotal historical milestones often include the wheel, agriculture, Magna Carta, printing press, Columbus’s voyages, the Scientific Revolution, Industrial Revolution, French Revolution, World War II’s end, and the internet, each driving cultural shifts and technological advancements.
Conclusion
0-60 times remain a useful, if imperfect, snapshot of launch performance. Coincidentally, the metric has evolved from a magazine curiosity into a headline figure just as powertrains became more complex, making straight-line speed easier to quantify yet harder to interpret. Vehicle weight, traction, gearing, and torque delivery often matter as much as horsepower. In the real world, 0-60 data best serves as a comparison tool, not a complete measure of drivability, efficiency, or overall capability.